The ROWING program meets all of the following calculational requirements:
a. Shell velocity- The calculated shell velocity at the end of the stroke must
exactly equal that at the beginning of the stroke.
b. Net work- The calculated overall net work of the stroke must sum to zero.
c. Internal momentum work- The calculated net internal (body) momentum work of
the stroke must sum to zero.
d. Oar sweep arc- The sum of the calculated incremental sweep arcs must equal the
independently defined total sweep arc.
e. The speed curve of the system center of mass must cross the curve for shell
speed at the stroke finish.
f. In Figure 4-5, Component Speeds- The areas (excursions of the mass points)
under the stroke and the return shell-relative speed curves must be equal.
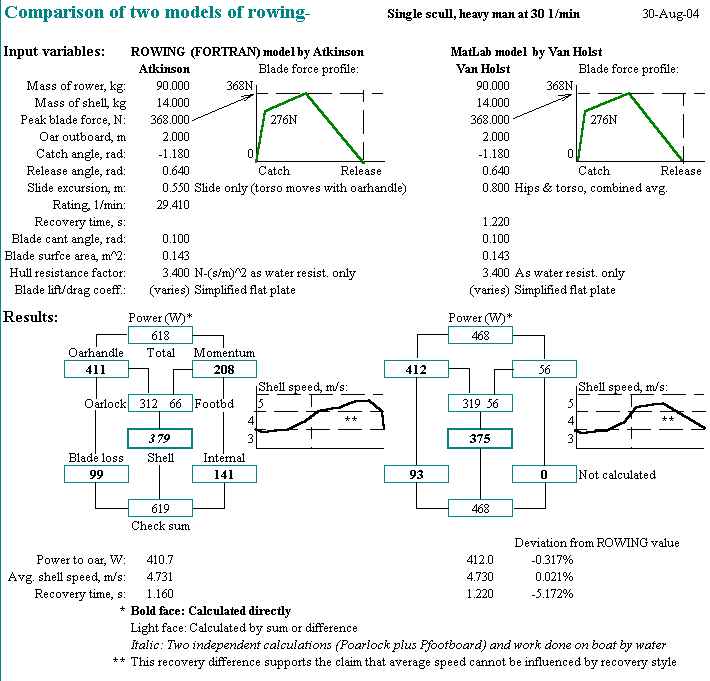
Delft University professor Marinus van Holst has put forward a MatLab computer model of rowing sufficiently sophisticated that his work can reasonably be compared with that of the ROWING model.
Below is a table of comparison between the two models run for a single scull. Although their input requirements and calculation details are somewhat different we have run each model with input variable values made as close as can be conveniently managed. The close concurrence of the emergent average shell speed and power relationships surprised us both:

Van Holst's model is not set up to estimate the energy lost internally in the body of the rower himself and so we find different values for the total rower power expended and for the overall efficiency.
Roosendaal's comparison is modeled in Python and--for the same input set--gives results very close to those of ROWING and of VanHolst. His average speed and blade loss results are very close; his shell work is a bit different owing to the use of a different wetted surface estimate.
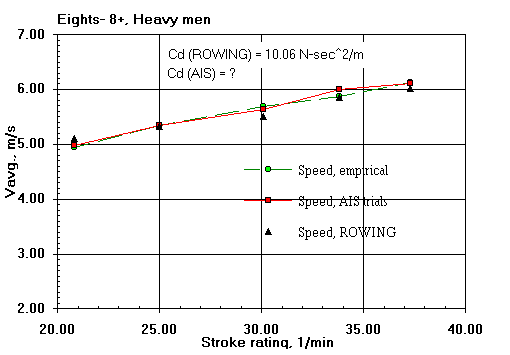
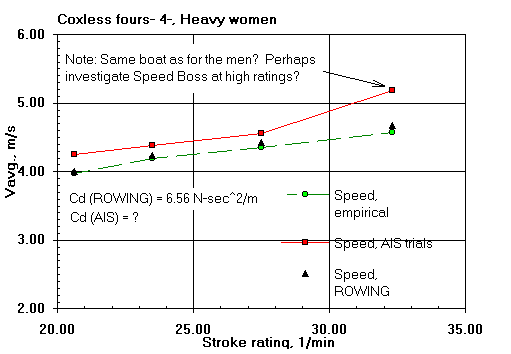
Here are some comparisons of ROWING's predicted shell average speeds with those of the field trials of V. Kleshnev of the Australian Institute of Sport (AIS). That the predicted speeds agree well with the field results gives me confidence in the validity of the ROWING model.
The differences are within the range of expected errors in speed measurement and errors in the estimation of boat resistance (both water and air). Keep in mind that course-calibrated hull mounted speed measuring devices can depart from true average speed measurements by as much as two percent; and by much larger amounts if not so calibrated. Only the boat general types are known and consistent values of drag factor have been assumed for them. Oar blade hydrodynamic characteristics have never been measured. Wind was not measured in the field data. The results from the model will, of course, show more consistency than those taken on the water.
Input to the ROWING model:
Boat and oar dimensions and characteristics, rower weight and height,
oarshaft drive angular sweep (a function of rower size), peak oarhandle force,
momentum management specifications, and stroke rating.
| Rating, 1/min: | 21.6 | 24.1 | 26.7 | 33.0 | 35.6 | |
| Peak force, N: | 706 | 706 | 734 | 719 | 717 |
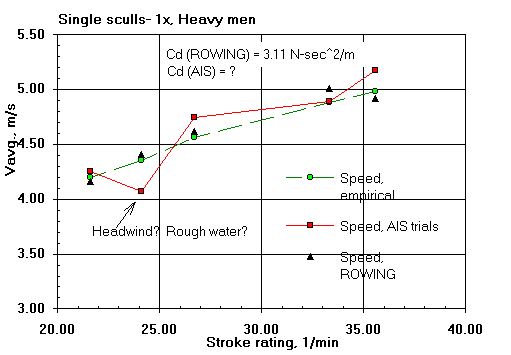
Note: I have found an empirical relation between average shell velocity(V) and the ratios of rating(R), peak force(F), and shell friction resistance factor(K):
V2 = V1 (R2/R1 *F2/F1 *K1/K2)0.365
| Rating, 1/min: | 20.9 | 24.4 | 31.1 | 36.3 | 43.5 | |
| Peak force, N: | 679 | 722 | 697 | 707 | 697 |
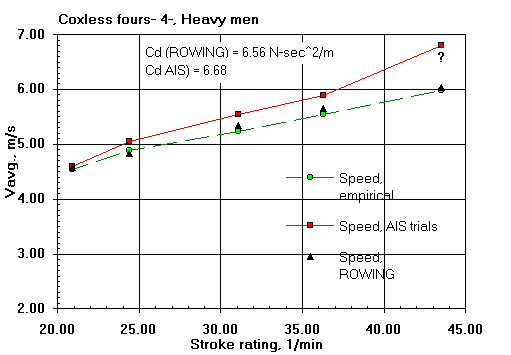
| Rating, 1/min: | 20.6 | 23.5 | 27.5 | 32.3 | |
| Peak force, N: | 485 | 496 | 476 | 471 |
| Rating, 1/min: | 20.8 | 25.0 | 30.1 | 33.8 | 37.3 | |
| Peak force, N: | 596 | 626 | 629 | 614 | 637 |
