Cast a vote here if you think it should move up in the Top-100 ranking:

You will be transferred to the Top-100 site, but may then return here by going "BACK"


TITLE: Modeling the Dynamics of Rowing (50 pages approx.)
SUBJECT: A comprehensive description of the computer model ROWING 9.00
AUTHOR:
William C. Atkinson, PE, USRA
343 South Ave., Weston, MA 02493-1948
watkinson@compuserve.com
KEYWORDS: ROWING, COMPUTER, MODEL, PHYSICS, SHELL, CREW, EIGHT, OAR, LIFT, DRAG
ROWING:
The paper describes in detail the program ROWING 9.00, a comprehensive computer model of the dynamics of Eights, Fours (coxed or not), and Doubles propelled by sweeps. It models Quads, Pairs, and Singles with sculls.
ROWING contains the detail necessary to give it predictive power in the study of crew-to-shell momentum exchange options, and as a reliable substitute for the expense, difficulty, and irreproduceability of field trials in the evaluation of experimental rowing styles, oar blades, and of boat designs and arrangements. Because researchers in these fields seek accurate differences rather than absolute results it matters mainly that a model produce a reliable and reasonable result rather than a perfect absolute answer. I believe that ROWING accurately models a sufficient number of the relevant variables to give it this capability.
One gains confidence in the predictive power of such a model only through the comparison of its output with accurate data taken, under field conditions, from instrumented shells. Recently I have found some good examples of such data and have shown the model to have predictive power in regard to this data. However, I continually seek more.
I have written some non-standard versions of the model to look into the efficiencies of sliding rigger models (viz. Virus Boats) and forward facing (viz. FrontRower) styles as well as versions for one rowing ergometer.
I know of only one other serious attempt to build a computer model of rowing done at MIT ca. 1980 by Prof. A. Douglas Carmichael. It suffers from failing to address oarblade slip and its associated losses (slip assumed to be zero) and from omitting the internal body work losses. It does not calculate the work done at the footboard (a significant addition to that done at the oarlock).
ROWING is written to calculate in English units. In the articles which follow I have done what I can to present the results in metric units.
THE MODEL:
The design of this model did not emerge seamlessly from the rigorous application of a high degree of theoretical first principles but, rather, takes its form from the application of relatively simple engineering concepts coupled with the use of practical approximations to reduce computational complexity.
ROWING makes no initial assumption as to the nature of the shell velocity profile--such as defining it as portions of half-sine waves. The velocity profile produced by ROWING emerges as a natural consequence of the instantaneous forces involved and their action upon the shell. The ROWING velocity profiles closely resemble profiles taken from real shells on the water (Fig. 4-1).
ROWING divides a single stroke cycle into twenty "regimes" (some overlapping, Fig. 3-3)--twelve in its drive and eight in its free portions-- in each of which forces of friction, propulsion, or momentum act. In addition ROWING divides each stroke into 1,000 time intervals. An incremental solution then proceeds, via .ation, for any specified stroke rating or free (blades- in-air) absolute time period. Using initial assumptions for shell speed and for the ratio of the drive (blades-in-water) to the free time periods ROWING adjusts this (drive/free) period ratio until the calculated shell distance traveled during the drive portion of the stroke, as defined by the equation of motion, satisfies the corresponding shell advance, as required by the specified sweep lever geometry, sweep shaft stiffness, blade "aerodynamics" (lift and drag, Figure 4-7), and the blade zero-slip sweep.
The resulting iteration proceeds until initial velocity and period ratio agree to within less than one-tenth of one percent and until the residual shell work sum has been reduced to three m-N per stroke or less (the net work done on the shell must sum to zero since there is no net shell acceleration). In fact, one could give no credence whatever to a model which failed to sum the net shell work to zero.
In case comparisons I estimate the average speed results to be consistent within about plus or minus 0.001 m/sec.
ROWING models portions of the momentum exchange forces by means of parabolic force and velocity distributions. ROWING interpolates blade hydrodynamics from a table of lift and drag coefficient values vs. fluid angle of attack.
The oarblade slip is calculated with reference to the blade's zero-slip locus (mathematically an oblique tractrix); the path approached by a neutral, thin, and flat reference blade. No blade would ever exactly follow this theoretical locus but it may be reliably used in blade performance comparisons.
An alternate mode allows ROWING to make comparisons of any input variable change at constant rower total power output to within 1.0 Watt.
Written in FORTRAN, ROWING runs in DOS 6.2.
Input variables accommodated by ROWING:
o Number of rowers
o Shell length and saxboard beam
o Shell prismatic and block coefficients permit interpolation of variation
of resistance with displacement from data for previously tested shells
o Shell and crew fluid base resistance factors (water and air)
o Seat slide, arm bend, and sweep handle excursions (based on rower size)
o Rigger half-spread and rower reach
o Sweep code (sweeps or sculls)
o Sweep (or scull) length, handle length, blade area, blade
(cant) angle, and oarshaft vertical angle (10 deg. fixed)
o Sweep (or scull) shaft specific stiffness in bending
o Fresh or salt water temperature
o Blade hydrodynamic coefficients of lift and drag as functions of
instantaneous fluid attack angle (Figures 3-4 and 4-7)
o Blade (axial) fluid skin friction coefficient
o Weights of rowers, coxswain, boat, and sweeps or sculls
o Added mass--effective thickness of the bound fluid boundary layer
(contributing to the inertial mass of the shell)
o Peak tangential oar handle pull force (two points) and corresponding pull
force regime accelerations
o Free (blades-in-air) time period; the only gross timing parameter under
the control of crew or coxswain
o Momentum and momentum force regime acceleration timings for body mass
points (upper: torso, arms, head; and lower: hips, thighs; Figures 3-2, 3-3,
4-2)
Free acceleration of sweeps and upper body mass from the start to the
catch and the corresponding deceleration from the release to the finish
o Exponent of shell velocity (V^x) where x may take any positive value in
the expression for the hydrodynamic resistance of the shell--commonly 2.0 but
smaller values sometimes seem indicated
o Initial estimate of shell speed and drive/free period ratio
For more detail on input requirements see the ROWING Data File. You may here download the blank input data file, row.dfm.
Output (emergent) values calculated by ROWING:
o Shell speed and speed profile (Figure 4-1; average, max/min)
o Mass-center speed
o Stroke rating, 1/min
o Drive and recovery time periods
o Shell and system mass-center accelerations (Figure 4-4)
o Distance traveled per stroke
o Work done (on sweeps, on shell; in momentum (internal, external))
o Frictional forces on the shell
o Losses (shell friction, blade slip, blade skin friction)
o Oar shaft angular velocities; blade radial and tangential velocities
o Oar blade angles of attack, lift and drag forces, hydrodynamic stall and
lift recovery points (Figure 4-7)
o Forces resulting from oar handle and shaft mass accelerations
o Oarhandle impulse
o Power expended by crew
(Figure 3-6, internal, external,
total)
o Crew mechanical efficiency (Figure 3-6, shell friction work/ crew total
work)
o Oar blade mechanical efficiency (oarlock work /oar handle work)
o Oar blade slip (Figures 3-5, 4-6, zero-slip blade locus and sweep,
apparent slip)
o Fresh or salt water density and viscosity
o Shell waterline length, waterline beam, draft, displacement volume,
wetted surface area
o Reynolds' and volumetric Froude number
o Average ITTC-'57 resistance coefficients (water, from hull parameters and
instantaneous hull Reynolds' number)
o Oar shaft length
o Oar shaft catch and release point bow angles
o Weight summary (boat, coxswain, crew, sweeps; live, dead)
Output tables produced (ordinates vs. time and stroke interval; 1,000 instantaneous values per stroke cycle):
1. Cumulative time increments
2. Shell speed
3. Shell acceleration
4. Cumulative shell distance traveled
5. Oarhandle pull force
6. Propulsive force (on water)
7. Shell fluid friction resistance
8. Upper body momentum force on footboard
9. Lower body momentum force on footboard
10. Total footboard force
11. Oarlock force
12. Upper body (torso) relative velocity
13. Cumulative net work done on shell--sums to zero
14. Seat slide relative velocity
15. Oar shaft angular velocity
16. Oar shaft bow angle
17. Blade angle of attack
18. Blade attack velocity
19. Hydrodynamic lift and drag forces
20. Shaft tangential velocity (at blade center)
21. Shaft radial velocity (at blade center)
22. Speed of center-of-mass
23. Oar handle relative velocity (longitudinal)
24. Oar blade theoretical zero-slip and actual path loci
PROGRAM FIGURES:
Some program Figures from the body of the complete paper follow. Except as noted here they need little explanation.
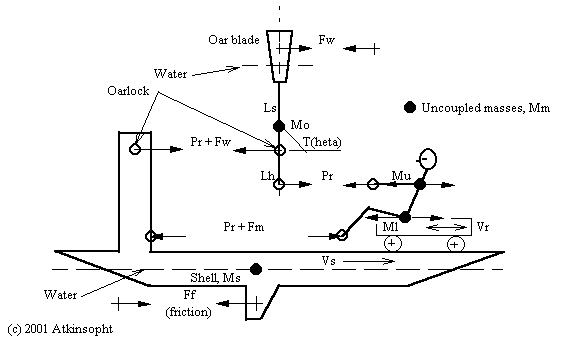
    Vs = Velocity of the shell relative to the water
    Vm = Velocity of the uncoupled mass(es) relative to the water
    Vr = Velocity of the uncoupled mass(es) relative to the shell *
         dVr/dt = dVs/dt +dVm/dt
    Ms = Deadweight mass of shell, coxswain, and bound fluid layer *
    Mm = Uncoupled (momentum) mass(es): lower body, upper body, oars (Mo) *
    Mt = Total mass of system = Ms +Mm *
    Pl = Equivalent longitudinal pull of the rowers on the oarhandles *
    Pw = Force of the water on the oarblades = -Ps = Pl sin^2(T) Lh/Ls
    Ps = Propulsive force on the shell = -Pw (independent of blade design)
    Kt = Fluid friction factor = Kw +Ka for water (hull) and air
    Ff = Fluid friction force on shell = Kt Vs^2
    Fm = Uncoupled momentum forces on shell = Mm(dVs/dt +dVm/dt) = Mm(dVr/dt)
    Fs = Mt(dVs/dt) = Ff +(Pl -Pl +Pw) +Fm
       = Mt(dVs/dt) = -Kt Vs^2 +Pw +Mm(dVr/dt)
    Equation of motion:
               /Vs2
    T2 -T1 =Mt |  dVs /(-KtVs^2 +Pw +Mm(dVr/dt))
               /Vs1
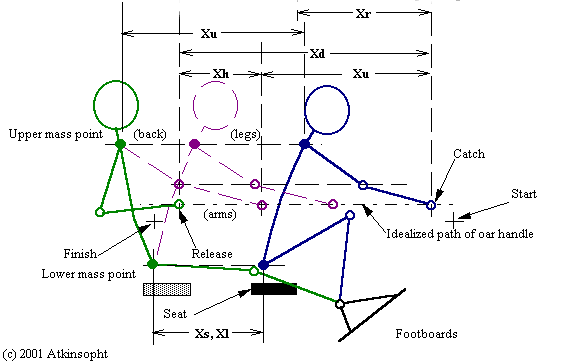
    Xr = Reach excursion (aft of pin centers, stretcher location related) *
    Xd = Total rower draw excursion (height related) *
    Xb = Hands/arms bend excursion *
    Xs = Slide excursion *
    Xu = Upper mass point excursion (torso, head)  = Xd -Xb
    Xl = Lower mass point excursion (hips, thighs) = Xs
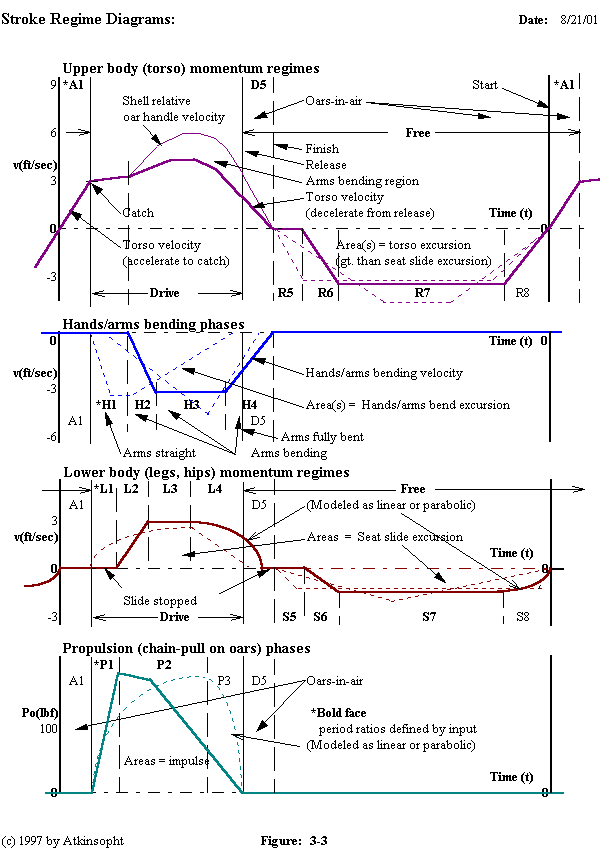
Regimes are designated as R5, H3, S6, P1, etc. and the percentage of time that each occupies in the 1,000 increment stroke cycle is defined by program input. Thus, variations in the management of rower momentum and oarhandle pull can be modeled. An amount of "poise" may be defined after the tap down.
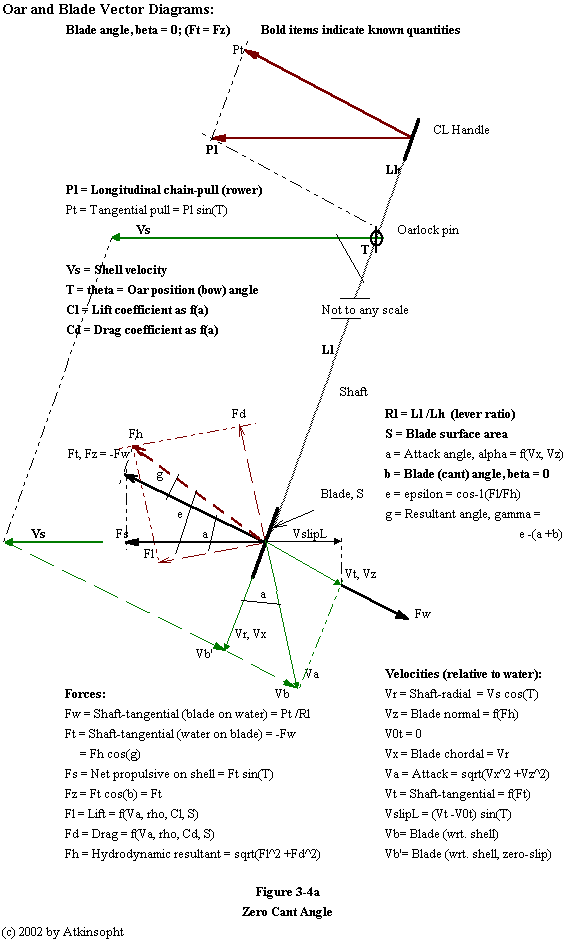
The shaft tangential reaction on the blade by the water (Ft) is always in static equilibrium with the tangential force (Pt) on the handle. Ft is uniquely determined by Pt (not by blade characteristics). In addition, the blade-normal component of the hydrodynamic resultant of the lift and drag forces, Fh, must balance Ft. This equality is the key to the determination of slip. At the beginning of each oar position increment the blade-normal slip velocity (Vz) is unknown. An initial assumption is made introducing an iterative process for the slip resolution.
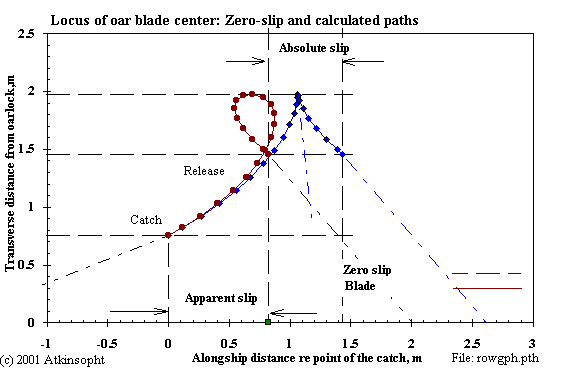
Without knowledge of the zero-slip path the absolute slip of an oarblade cannot be determined. Thus, it is necessary that any rowing model calculate the theoretical zero-slip locus.
EXAMPLE FIGURES:
Dynamic Racing Shell Model (all plots show instantaneous values calculated by ROWING)
 Kleshnev data, heavy men- 1+, 26.7 1/min, 717 N peak, 250 m, 4.74 m/s avg.
 Impulse- 500 & 635 N-sec (peak pulls corrected)
 Release @ 500

 ROWING:    (hmen1-r3.dat)- Ver. 9.20 (At iteration    3)      1/14/ 2 11:24: 7
            Oarhandle pull-   580.02 & 774.84 N;   Ddwgt.-    22.14 kg;  13.3C
     Catch oar shaft angle-    22.50 deg; Zero-slip sweep-     4.32 m
   Maximum oar shaft angle-   126.78 deg;    Release Angl-   132.53; dAngl-110.0
          Blade cant angle-     6.00 deg; Oar lever ratio-     2.29; SwpEff=0.86
      Stroke period length-     2.25 sec/cycle;    Rating-    26.700 strokes/min
    Drive/run period ratio-     0.709;      Absolute slip-     0.61 m;  Hydrfoil
              Drive period-     0.909 sec;    Free period-     1.338 sec
    Oar blade surface area-   715.37 cm^2;  Apparent slip-    -0.82 m
    Calculated sweep: DrvC-     3.713 m;  Geometric: DrvA-     3.707 (iterated)
 SHELL SPEED:      Initial-     4.12 m/sec;         Final-     4.12  (iterated)
             Minimum (101)-     3.55;       Maximum (737)-     5.34;  Amp.= 1.8
 T2km- 433.4 sec;  Average-     4.61 m/sec;  15.14 ft/sec;     0.00- Wind kt
  Resist. facts. KWa,KA,KTa-     0.065 0.006 0.071; Implse-   448.60  N-sec/rowr
 WORK: Shell friction work-  -789.45 J/stroke;     Expt.V-     2.000; S= 2.26 m2
       Momentum lower, ext.-    33.66; Momntm. lower, int.-    87.81; L=  85 kg
       Momentum upper, ext.-   107.48; Momntm. upper, int.-    95.31; D=  22 kg
            External total-   141.13;      Internal total-   183.12; T= 107 kg
      Shell net (residual)-     0.13; Oar blade skin loss-    -8.22; W=  90 kg
      Direct shell oarlock-   648.45; Oar blade slip loss-  -186.18; N= 1 rowers
      Total oarhandle work-   842.84;     Oarhandle power-     0.3752 kw/rower
          Total rower work-  1167.10;         Rower power-     0.5195 kw/rower
 EFF:  Oarblade mechanical-     0.769;  System mechanical-     0.676  An= 2.622
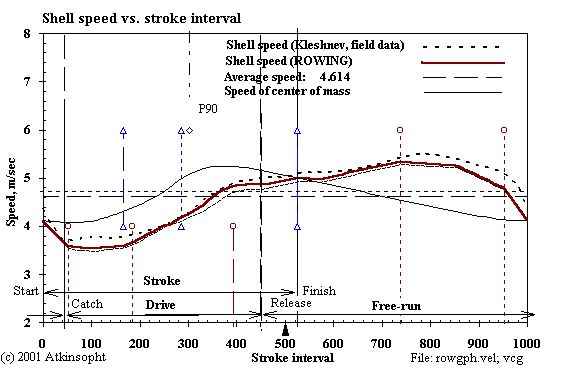
The significance of the speed, acceleration, and footboard force curves plotted here by ROWING lie in their very close match to the underlying profiles (dotted) taken on open water from an instrumented boat by V. Kleshnev. I obtain the match by varying ("coaching") the stroke geometry, the time profiles of the seat and torso momentum exchanges, the hands/arms bending, and the oarhandle pull force regime. ROWING cannot significantly modify the shell speed profile in any other way than by coaching the momentum exchange profile; and, of course, neither can real rowers.
Notice that the mass-center profile is as it must be--a smooth (friction only) descent from the point of the release.
Note that the shell speed curve--and especially that of the center of mass--is far from lending itself accurately to representation by means of half-sine waves.
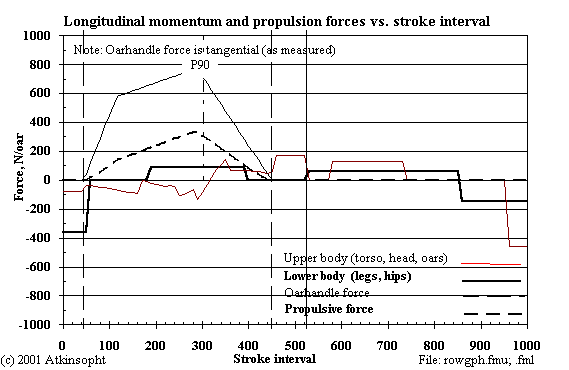
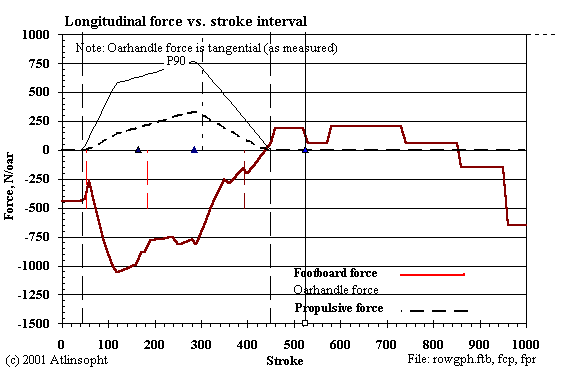
Note here that the oarhandle force (while shown separately) is actually included in the (negative) footboard sum which includes the upper and lower body momentum forces as well. To see how the arm force differs from the leg force redraw the "reflection" of the oarhandle force curve below the zero force axis. Their difference is the result of the momentum forces. The two curves cross at points where the arm and leg forces are equal.
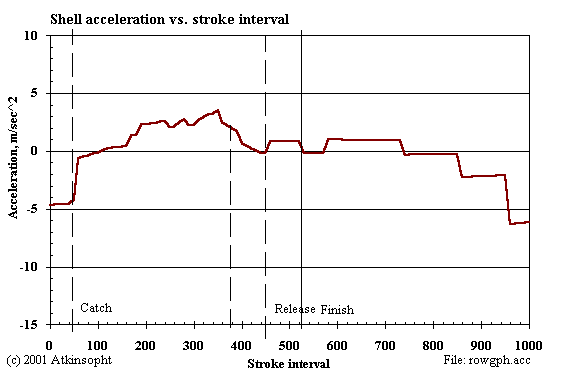
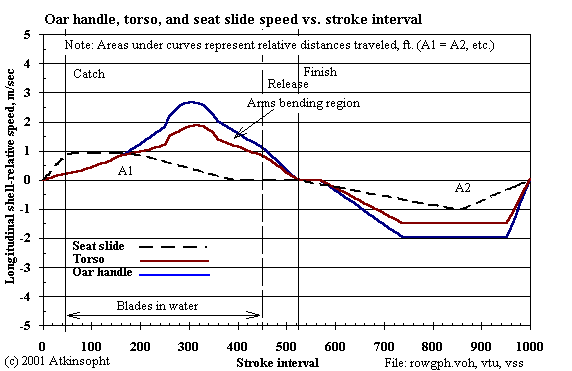

This figure will interest those who believe that the absolute slip of the blade is very small (here the apparent slip is as much as one meter negative-- while the corresponding absolute slip is actually 0.6 m positive.).
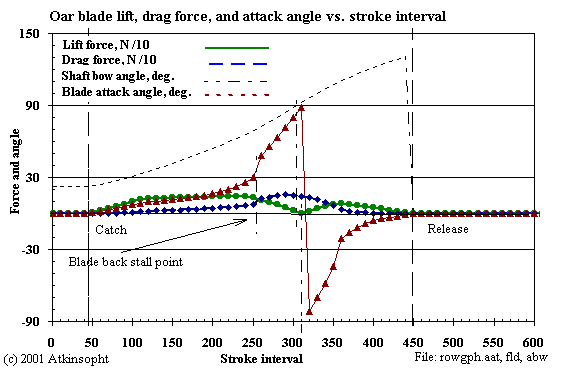
Here one sees how the motion of the blade affects the lift and the drag as the angle of attack varies. At attack angle 90 degrees the lift is zero and the drag force alone balances the blade propulsive force--the rower's effort divided by the oar lever ratio. At all other angles of attack it is the lift- drag force resultant which always balances the rower's effort.
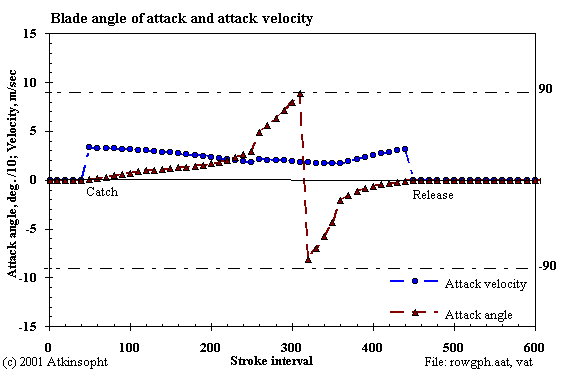
In the course of the drive the attack velocity can vary by 100 percent or so while the attack angle swings from zero through 180 degrees. At the end of the stroke the blade's original trailing edge has become the leading edge. One reason, I think, not to think too narrowly in terms of classic (NACA) airfoil theory. Near the two ends of the drive at small attack angles lift forces are small, in spite of high coefficients, because the rower's effort is small.
Beacuse of the relatively small catch bow angle the blade's initial attack velocity is near the shell speed. At mid drive it is essentially the slip velocity and at the finish it is limited by a relatively large release stern angle.